Quick Start
RasterFlow is built around a simple idea — image editing should feel fluid, logical, and completely reversible. Instead of layers and filters, you work with a living graph of operations that update in real time. Every connection you draw is part of a visual process you can always see and modify.
Here’s how to create your first graph and see it in action:
Drop an image onto the canvas
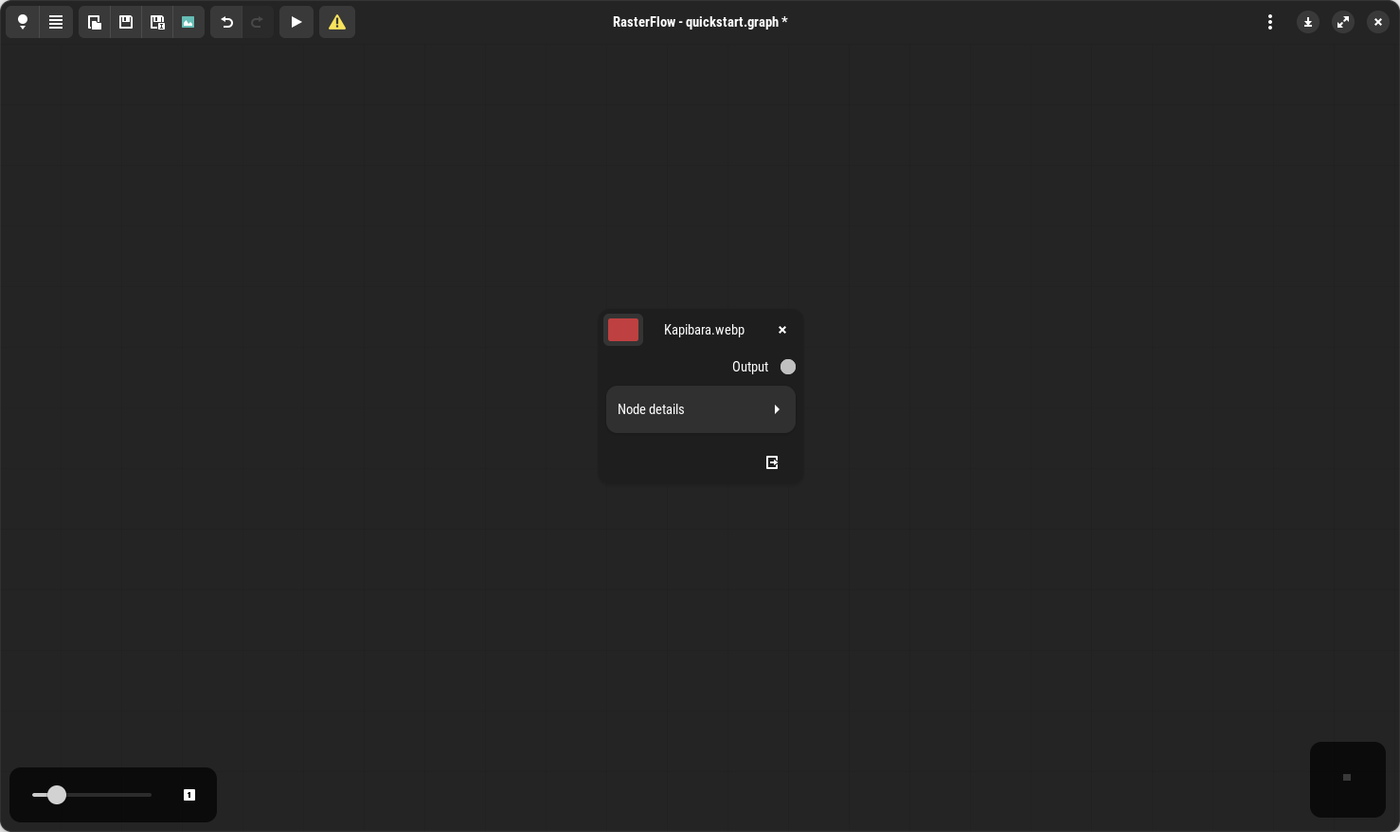
Drag any supported image file from your local drive into RasterFlow.
The application automatically creates a gegl:load node and assigns the file path for you.
Draw your first connection
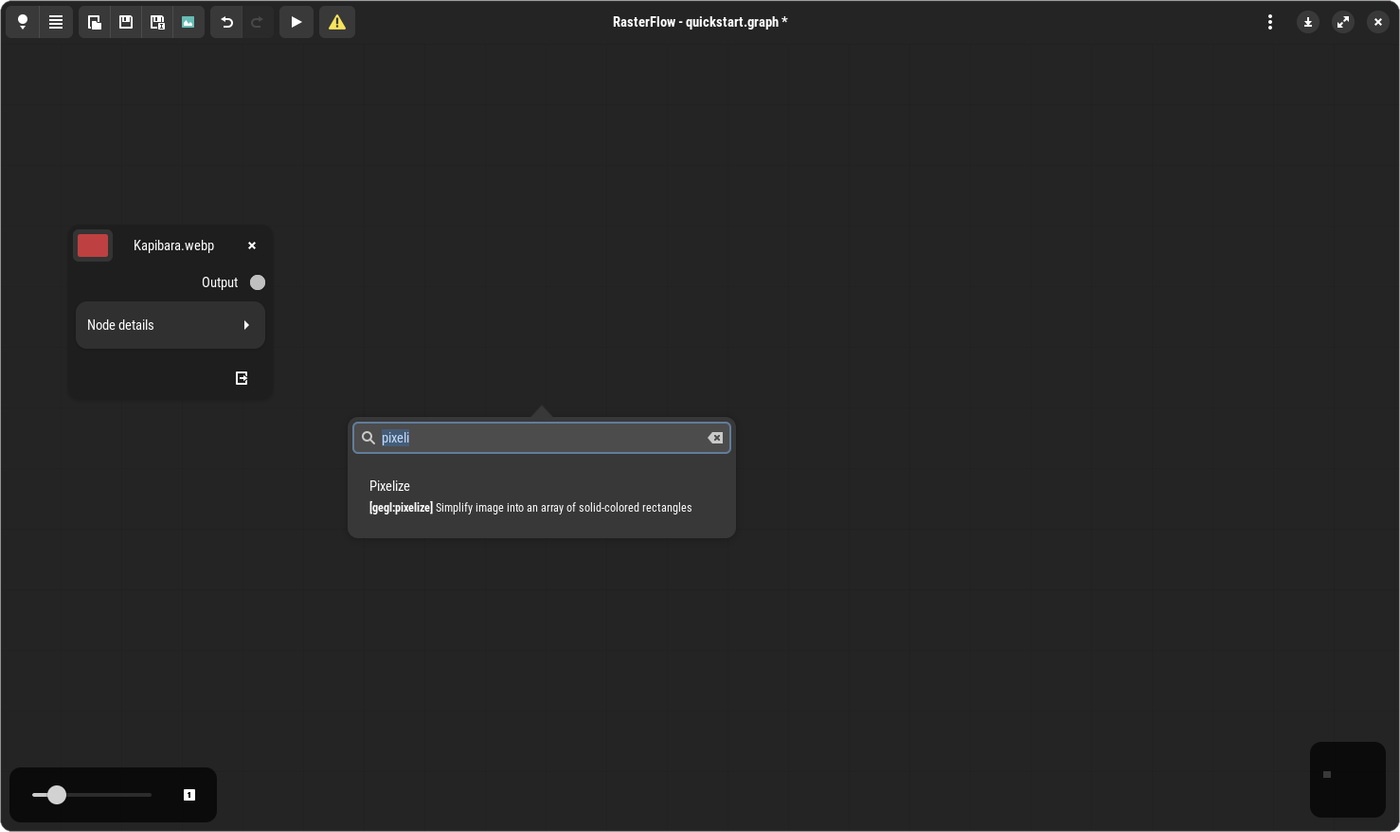
Grab the Output pad from the image node and drag it outward. When you release it into empty space, a popup will appear allowing you to select the next operation. RasterFlow gives you access to more than 250 GEGL operations to choose from.
Add the “Pixelize” operation
Select Pixelize from the list. A new node is instantly added and connected to your image source.
The gegl:pixelize operation turns your image into a mosaic of solid-colored blocks — ideal for stylized looks,
privacy masking, or pixel art effects.
Connect to a viewer node
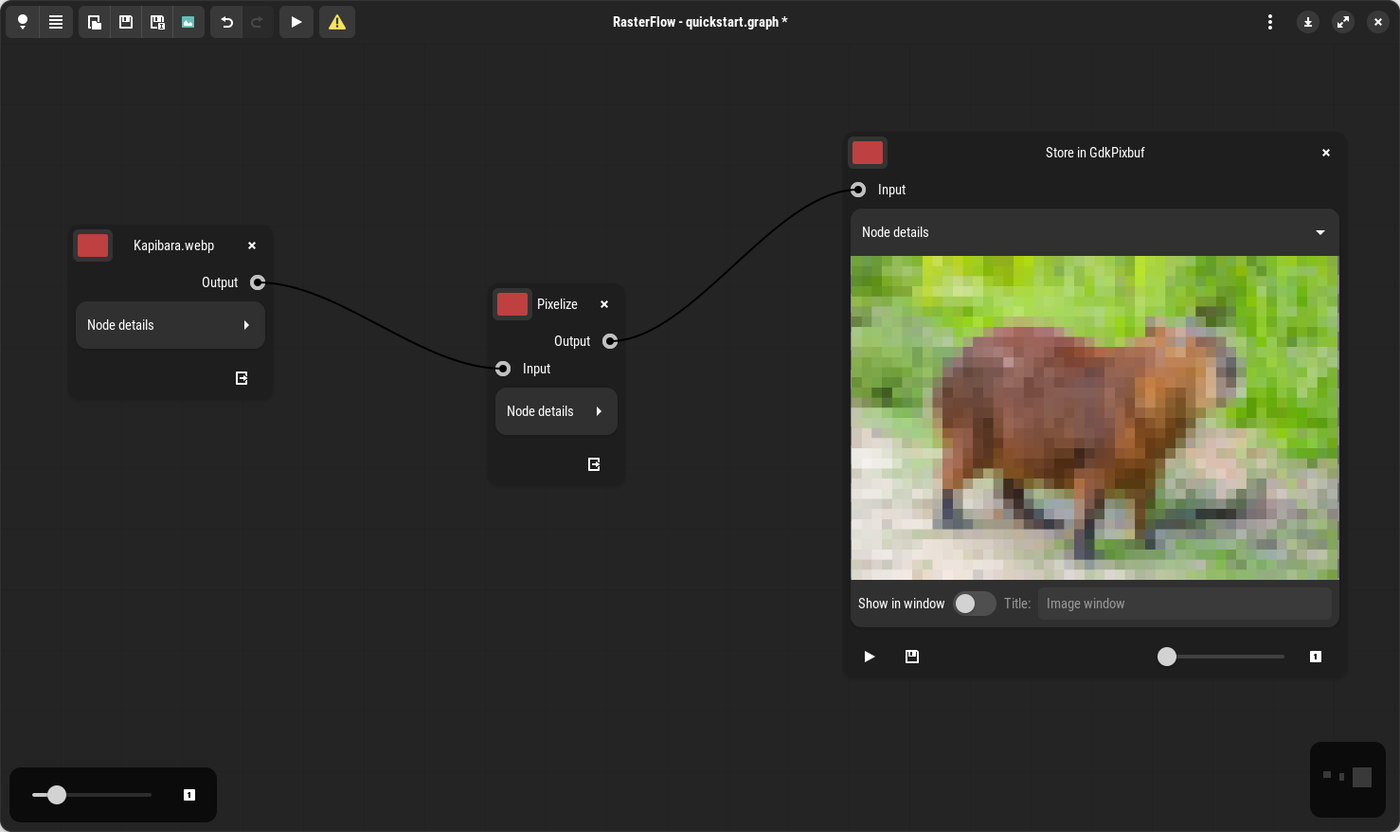
From the Pixelize output, draw another connection to a display node like Store in GdkPixbuf.
This node renders the processed image inside RasterFlow and provides zoom, pan,
and a save button for exporting the result.
Adjust the effect
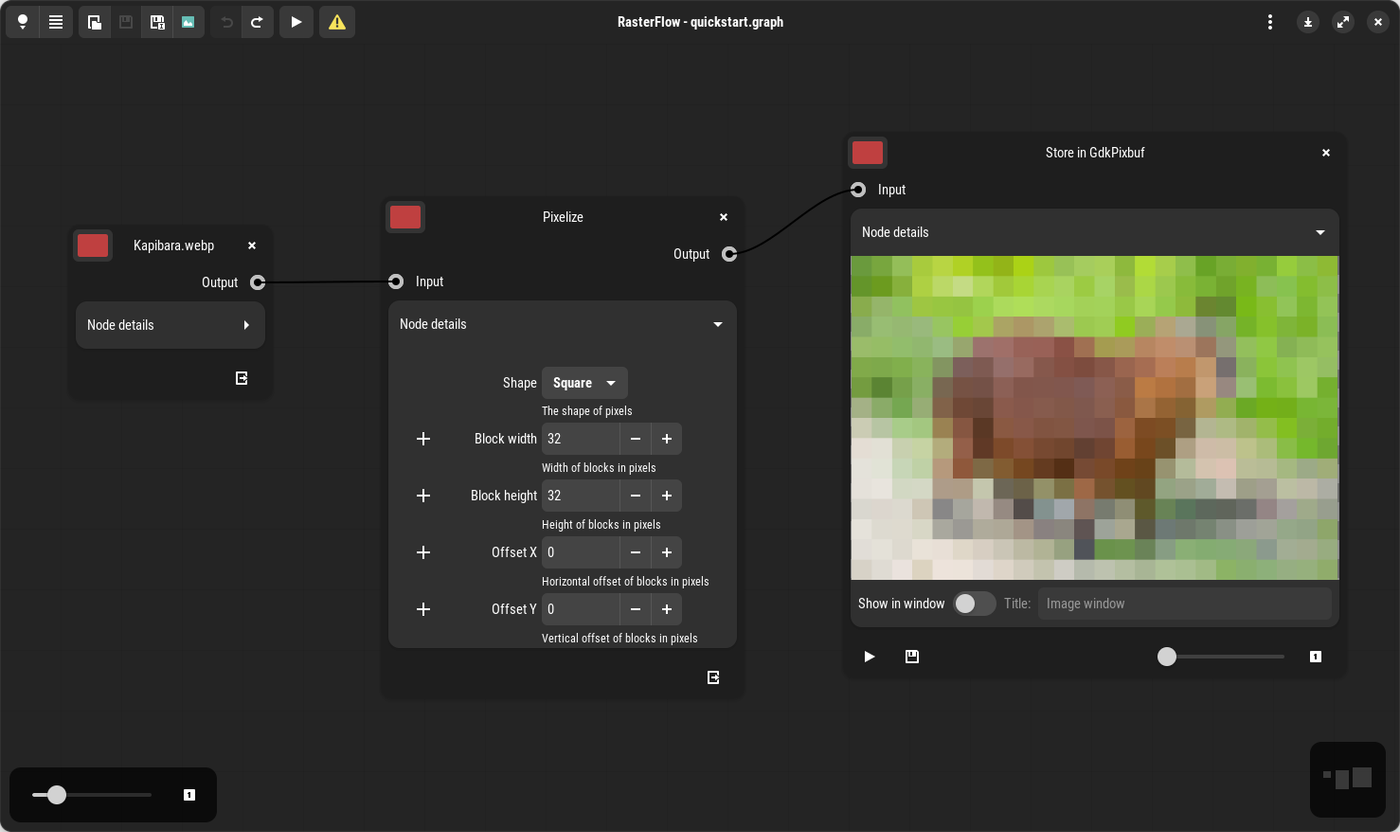
Select the Pixelize node and open Node details to access its parameters.
Adjust block width, height, or shape to fine-tune the look.
When you’re ready to preview the result, click the Play icon on the Store in GdkPixbuf node —
it will render the processed image based on the current settings.
Enable live updates
To see your changes update automatically as you tweak parameters, use the Play toggle button on the application’s toolbar. Once enabled, RasterFlow will refresh the preview in real time, letting you experiment freely without manual re-rendering.
Explore and refine your graph
In Pixelize click Node details to open its parameters.
Modify block width, height, or shape to fine-tune the look.
Changes appear instantly in the live preview, so you can iterate freely.
Export your output
Once you’re satisfied with the result, use the viewer’s save button to export your image, or save the entire graph as a project for future editing.